Loading information: Loading 3D files in a browser can be taxing due to network and graphic constraints. Please be patient. If loading takes more than a couple of minutes, restarting your browser might help.
Simulation information
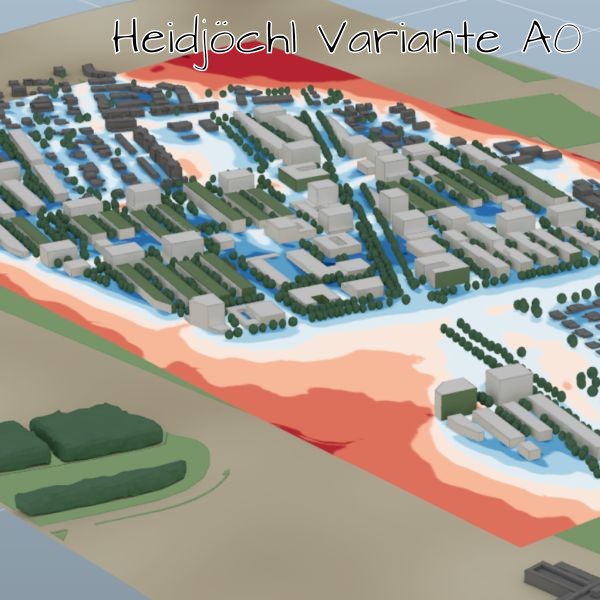
Simulation name: Heidjöchl Variante A0 | Updated: Jan. 31, 2024, 6:48 p.m.
A descriptive text about this simulation can be added here.Using this website

Overview
The main elements of this website are a 3D-area that fills most of the screen, several display- and toolbar-elements to the left and a retractible sidebar on the left edge of the screen.
With the symbols in the upper left corner the sidebar visibility can be toggled.
The toolbar symbols on the left side allow some general actions - from top to bottom: toggling fullscreen, resetting the 3D-Panel Menu, project information and show this panel.
3D Navigation
Navigation in the 3D-area works best using a mouse.
LMB drag
(clicking with the Left Mouse Button and dragging while holding the button) rotates the model, RMB drag
panes the viewport to move sideway or up and down and MMB scroll
zooms in and out.
On touch devices, the following command can be used: Rotate - one finger swipe, Pan - two finger swipe, Zoom - two finger pinch
3D-Panel Menu
The 3D-Panel Menu can be used to toggle the visibility of 3D elements. There are several sub-panel available to toggle geometric elements, respectively simulation results.
Clicking on a title section within a subpanel will fold/unfold that section and toggling elements within these section will toggle the visibility of the respective element.
The placement symbol to the upper left of the menu can be dragged to move the menu.
Sidebar
When the left sidebar is visible, clicking into the simulated area while holding the ALT key
ALT + LMB
will set a marker at the mouse position. The website will then fetch additional data for that position and display them in the side panel.
This makes it possible to visualize various parameters like air temperature, apparent temperature, humidity etc. for that particular location over the course of the simulated time (usually a day).
Please note, that for technical reasons, the data displayed on the website may be slightly shifted from the actual clicked position.
Microclimate Simulation
Depending on the type of simulation, different parameters might be displayed. In most cases, the simulation results that can be toggled via the 3D-Panel Menu will show various color surfaces. The colors of the legend correspond with the last-selected element.
In most cases the following variables will be visible:
- AT
- apparent temperature (Steadman) [°C]
- UTCI
- Universal Thermal Climate Index [°C]
- T
- air temperature [°C]
- Tsa
- surface temperature [°C]
- U
- wind velocity [m/s]
- rh
- relative humidity [%]
- X
- absolute humidity [-]
Various indexes are used to show a particular parameter at a certain point in time (e.g. _0600 or _1500 for 6:00 and 15:00 respectively) or space (e.g. _1.5 or _15 for 1.5 meters respectively 15 meters above terrain).
Heidjöchl Variante A0
Legend

A
B
C
Unit
Result
Select parameters from the 3D menu and
ALT + LMB
click in the 3D window to load additional data.
Loading
Data Dashboard
Data Dashboard Content
Symbolic Example Data Dashboard Content
Temperature Comparison between Building Plots
Area per Temperature Classes
Daytime Temperature
Area Usage per Building Lot
Area per Wind Comfort Classes
Temperature / Humidity Classes
More Charts, with some additional explanation.
We can have a long text here with some explanation of what we are seeing below. As an alternative we could use a tabbed view at the start of the page, so that we can change from one tab to the next instead of scrolling down to reveal additional content.
For now, we will just add more charts to the page, so that we can see how the layout behaves with more content and longer texts like this one: Lorem ipsum dolor sit amet, consetetur sadipscing elitr, sed diam nonumy eirmod tempor invidunt ut labore et dolore magna aliquyam erat, sed diam voluptua. At vero eos et accusam et justo duo dolores et ea rebum. Stet clita kasd gubergren, no sea takimata sanctus est Lorem ipsum dolor sit amet. Lorem ipsum dolor sit amet, consetetur sadipscing elitr, sed diam nonumy eirmod tempor invidunt ut labore et dolore magna aliquyam erat, sed diam voluptua. At vero eos et accusam et justo duo dolores et ea rebum. Stet clita kasd gubergren, no sea takimata sanctus est Lorem ipsum dolor sit amet. Lorem ipsum dolor sit amet, consetetur sadipscing elitr, sed diam nonumy eirmod tempor invidunt ut labore et dolore magna aliquyam erat, sed diam voluptua. At vero eos et accusam et justo duo dolores et ea rebum. Stet clita kasd gubergren, no sea takimata sanctus est Lorem ipsum dolor sit amet. Duis autem vel eum iriure dolor in hendrerit in vulputate velit esse molestie consequat, vel illum dolore eu feugiat nulla facilisis at vero eros et accumsan et iusto odio dignissim qui blandit praesent luptatum zzril delenit augue duis dolore te feugait nulla facilisi. Lorem ipsum dolor sit amet, consectetuer
KPI Comparison between simulations
Temperature / Humidity classes
Daytime Temperature
Another Temperature Comparison
Area distribution
This sunburst chart shows the area distribution between and within individual building plots.
More Charts, with some additional explanation.
We can do other types of charts too!
Another demo chart
And Another demo chart
Some Tables
We can also show tables
| Werte in m² | Entwässerung über Versickerung | Angerechnete Fläche GFF | Abflusswirksame Fläche RWMF (gesamt) |
|---|---|---|---|
| Unbebaute Flächen - Vegetationsflächen | |||
| Rasen und Wiese (niedrige Vegetation) | 26.25 | 26.25 | 2.63 |
| Strauchflächen und Hecken (höhere Vegetation) | 47.84 | 52.62 | 4.78 |
| Unbebaute Flächen - Blaue Infrastruktur | |||
| Naturnaher Teich bzw. Wasserflächen | 79.56 | 79.56 | 0 |
| Sickerflächen, Rückstauflächen, Flächen Regenwassermanagement | 39.98 | 43.98 | 0 |
| Unbebaute Flächen - Erschließungsflächen, Plätze und versiegelte Flächen | |||
| Wasserdurchlässig (Abflussbeiwert < 0,2) | 20.11 | 8.05 | 4.02 |
| Teil-versiegelt (Abflussbeiwert < 0,5) | 50.27 | 10.05 | 25.14 |
| Versiegelt (Abflussbeiwert < 0,9) | 72.79 | 0 | 65.51 |
| Summe angerechnete Fläche Unbebaute Flächen | 336.81 | 220.52 | 102.08 |